Showing posts with label OBIEE 11g. Show all posts

Wednesday, November 02, 2016

OBIEE : Go Nav/ Go URL structure

The Go URL or Go nav is functionality of OBIEE, where summary reports  navigate to detail reports passing filters/options.

For example:

1) Basic structure:

http://<hostname>/analytics/saw.dll?Go&path= <full report path url>

2) To pass username and Password

http://<hostname>/analytics/saw.dll?Go&path= <full report path url>&NQUser=<username>&NQPassword=<password>

 3) To include Report links

Actual way to include the report links in drill/detail reports is to mention "&Options=x" in  GO URL path. The x can be one or more of the following letters:
  • m = Modify Request
  • f = Printer Friendly
  • d = Download to Excel
  • r = Refresh Results

 Like:  http://<hostname>/analytics/saw.dll?Go&path= <full report path url>&Options=md

or

http://<hostname>/analytics/saw.dll?Go&path= <full report path url>&Options=mfdr


4)  Printer Friendly. Results are in a printer-friendly format, without the paging controls, hot links, and so on.This is the format, "&Action=print" to be added in GO URL path

Like: ttp://<hostname>/analytics/saw.dll?Go&path= <full report path url>&Action=Print

5) Specific View. If your Detail report has more than 1 view of results (like Pivot/Chart/Bar graph etc) . This option shows an individual result view rather than the default compound view.
This is the format, where A is the name of the view:

http://<hostname>/analytics/saw.dll?Go&path= <full report path url>&ViewName=A


 6) To pass report filters:

Sometimes we get requirement in OBIEE summary report to drill to detail report passing few column filters, like: here we are passing 2 column values as filter in detail report. P0 defines the number of parameter passed including the type (equal/ >=  etc.)

http://<hostname>/analytics/saw.dll?Go&path= <full report path url>&Action=Navigate&P0=5&P1=eq&P2=<Parameter_Name1>&P3=<Parameter_value1>&P4=<Parameter_Name2>&P5=<Parameter_value2>


Note: Remove < > symbols. I have used them to highlight.

Monday, August 01, 2016

Steps to configure Write Back Functionality in OBIEE 11g

Write Back is the feature/ability in OBIEE to allow the user to enter a value or values directly into a report and have those values written to an actual physical table in the database.You can use this functionality only in a table view. If you want to use it on a pivot, you must first transform your table view as a pivot view

RPD changes to set Write Back :

Step 1:Physical Layer - Select a table to which you would like to Writeback. Double click it to open the Physical Table Properties.In General tab, uncheck Cache-able

Step 2: Business Model & Mapping Layer -Go to the table column (same as the physical layer.Double click column to open the logical column properties. In General tab, check Writable option.

Step 3: Presentation Layer -Double click the column and click on Permissions. Now in the General Tab -> Permissions -> Set permission -> Read / Write (Radio Button), on the User / Application Role which you want to authenticate for Writeback feature.

Step 4: User/Application Role - In RPD, Go to -> Manage-> Identity Manager -> Identity Management (Left pane) -> Select Application Role (to which you need Write Back Permission) -> Permission -> Query Limits (tab) -> Select Database (to which you need direct database execution rights) -> Change option from ignore to allow to the field named "Execute Direct Database Requests".


Write Back Template :

Step 1: Check the "LightWriteback" tag within  the server instance tag of instanceconfig.xml file. If it not true, set it to TRUE. If this entry already exists then no modifications required. If modified then restart OracleBI Presentation Services for this change to be effective.

<LightWriteback>TRUE</LightWriteback>


Step 2: Writeback Template. You may give any name for the Writeback.xml file. Here for example,we are using the file name as Writeback_sample.xml

Things to do before you start the Template:
  • We can use the column position or by column id in the XML definition. 
  • We must include both insert and update statements in the template.
Template to be placed in the path: $ORACLE_INSTANCE/bifoundation/OracleBIPresentationServicesComponent/coreapplication_obips1/analyticsRes/customMessages


[ Note -Above insert & update code is only for sample purpose & content within <!-- #### --> are comments. If we do not want to include SQL commands within the elements, then we must insert a blank space between the opening and closing tags. eg. <insert> </insert> rather than <insert></insert>]

In the above xml code, we have few important tags -


  • WebMessage name - The name here will be used as Writeback template name in analysis -> Table Properties -> Write Back.
  • Write Back ConnectionPool - Connection pool name for Write Back.
  • insert - Based on your requirement or leave blank ( if not required)
  • update - Based on your requirement or leave blank ( if not required)
Now lets proceed to know what changes we need to make in analysis for the write back report.

C- Changes in Analytics :

Step 1Give Privilege to the Role for Write Back ( Analytics Home Page ->Administration -> Manage Privilege -> Write Back & add the role for Writeback privilege). 
Step 2Now you need to go to that column, right click, open Column Properties -> Writeback tab-> Check 'Enable Write Back' of the field needed for write back, from criteria tab.
Step 3: Now edit & go to Table Properties view -> writeback tab & tick the 'Enable Write Back' & mention Template Name as mentioned in Writeback file ( WebMessage name="WriteBack_Template_Example). You may also rename Apply/Revert/Done Buttons & set positions.

Now please test the report for writeback features.


Courtesy : Google :) 
 

Wednesday, July 13, 2016

Data Visualization (D3) in OBIEE 11g

One of the great features of Oracle's Business Intelligence 11g foundation is the ability to integrate external applications through the use of java script libraries.Today we're going to expand on this functionality by integrating third party(open source) data visualization java script library used for data manipulation ie D3. To describe, its Data Driven Documents.

Oracle have added powerful new data visualization capabilities that turn raw data into insightful information.D3 helps you bring data to life using HTML, SVG, and CSS. D3’s emphasis on web standards gives you the full capabilities of modern browsers without tying yourself to a proprietary framework, combining powerful visualization components and a data-driven approach to DOM manipulation.  For example, you can use D3 to generate an HTML table from an array of numbers. Or, use the same data to create an interactive SVG bar chart with smooth transitions and interaction.

You can download or get the D3 files (HTML) online.These files contain the basic code of creating visual designs like Bar Column, Candlestick, Pie, Doughnut, Funnel etc. After downloading this file, either we can directly make an external call to it or we can place it in OBIEE server at following location (You can check with your admin to see if file needs to be placed on some other location also) :

user_projects\domains\bifoundation_domain\servers\bi_server1\tmp\_WL_user\analytics_11.1.1\7dezjl\war\res\

In order to embed a D3 visualization in OBIEE you’ll need to first create  sample report and then use a Narrative view to display products Transaction count via Region (example). This will enable you to gain access to the data that we need to drive our visualization using the @n substitution variables where n equals the column position in the criteria or in the array.

So let's create a simple report of Region, Product & its selling count. Now in Narrative View, we will try to create a doughnut design displaying Region wise Count spread.
In the Prefix section at the top we will declare a JavaScript array variable called “n” that will contain the data from the analysis like this:

var n=[];

This array will hold Data elements like below:


The Narrative section should contain the following code :

n.push({Count:@2, LegendText:"@1",indexLabel:@2});

where @1, @2 substitute for  Region & Transaction Count respectively and will dynamically generate the JavaScript to populate our array. LegendText tag is used to show the Regions in Legend, and IndexLabel is to show data value in Index.

 Now in Postfix section,we have to write load of JavaScript code, in which we call the array in a function, mention the font style/color/size, decide the legend style etc. It should look similar to below. You can modify it further as required.


Now if you see the final output:


Friday, April 01, 2016

How to Insert a Checkbox in Excel

Now a days excel is very useful to maintain information/data. Excel provides so many options to do our task in an interactive ans easy manner. Like inserting a checkbox in Excel. The checkbox control is available in the Excel developer tools option. Check box and other controls like drop down menu can be quite helpful while designing forms in Excel.

 How to start :

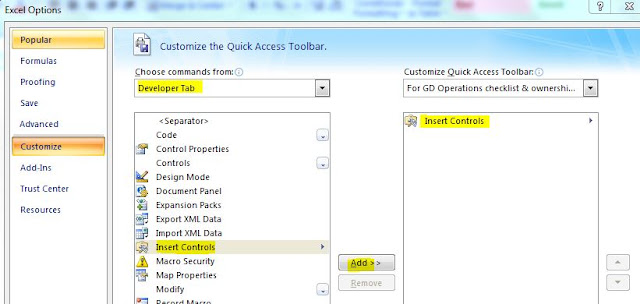
1) Open an excel sheet.Will show you how it works on 2007. Navigate to File > Excel Options > Customize > Now select Developer tab from drop down 


2)  In Developer tab , select the "Insert Control " option, add it to the “All Tabs” pane on right side and click the “OK” button.


3) Now you see “Insert Controls” tab/Button on your excel top ribbon. Click and you see lot many Controls like Form Control (Button, combo box,List etc) , ActiveX control(Img, Label, Radio button etc) .Select the “Checkbox” control from Form Controls as below


4) Now, you can drag and draw a checkbox anywhere on your excel sheet. Similarly with other controls. You can also play along with its properties.


:)


Wednesday, December 02, 2015

How to calculate Week Start Date and Week End date using DAY_DT in Obiee 11g

In OBIEE 11g, many times we have to calculate on the fly, the various dates functions like Week_Start_date, Week_End_Date, Previous_Yr_Date etc,  just using the Date column. Few projects have Date Dimensions not properly structured to have all columns. So here we have the logical sql's to calculate the same:
We can calculate the week start date using the below sql:
TIMESTAMPADD(SQL_TSI_DAY,- DAYOFWEEK(MIN(“Dim – Date”.” Date Column”)) + 1, MIN(“Dim – Date”.” Date Column”))

For Week End Date, use the below Sql:
TIMESTAMPADD(SQL_TSI_DAY, 7-DAYOFWEEK(MAX(“Dim – Date”.” Date Column”)), MAX(“Dim – Date”.”Date Column”))
DAYOFWEEK returns an integer in the range of 1 to 7. A value of 1 represents the Monday.
Courtesy: Google 
:)

Thursday, November 05, 2015

OBIEE11G : conditional-formatting for rows

What is Conditional formatting? In OBIEE, its actually applying GUI formats to our analyses columns like $, %, background color etc, based on a single condition or we can say using single logical operand. In this blog, will discuss the possibility of using multiple conditions together to get 1 specific row-column formatting. In OBIEE we get many complex requirements (Table/Pivot) like highlighting the value for Year = 2015 and region = East and data range from 0-200, then orange, 201-400 then green. But using OBIEE GUI conditional Formatting this is not feasible. We can do hit/trials by writing one condition , then override it with another condition, to get our results but it does not always work. OBIEE11g GUI doesn't allow us to write complex conditions.

For example: I have a business requirement to highlight row where region = EAST, and we have to show data with different colors in different ranges (like image below) :


If i try to achieve it using OBIEE GUI, column properties-> Conditional Format option, it will be writing multiple condition to override one another like:


But if we notice the conditions, it will effect all values of table which have value between data ranges, and not specifically only row which has  value EAST, like below:


Now lets proceed to achieve our complex requirement by playing with Advanced Tab->  Analysis XML.OBIEE reports are stored in an XML format. We can read it and find lot of information about functionality the GUI doesn’t allow to perform but can be coded manually.If you take out a copy of your report you will find that conditions are written in conditional formatting blocks, using logical operators like "Equal", "Between".


 We can similarly apply "AND" operator and write a different format condition like below:


Now when we go to column properties of data range column and see conditional Format tab, we found different condition, like sawx:exprsawx:logicaland. This explains usage of AND Operator.
If you try to edit it from OBIEE GUI, you cannot do it as formula is not seen. Hence, if again any change required, go to Advanced XML and make changes.


Note: Always keep a backup of your XML , before making any changes to it, since it not a play game.

Thanks :)


Friday, October 09, 2015

New Features in OBIEE 11.1.1.9.0 release:


 Some more new features have been introduced in latest OBIEE 11.1.1.9.0 release:-

Analysis Enhancement:

1.     You can initiate a search within the subject area displayed in the subject area pane; the option is “Subject Areas Pane”.
2.     You can save columns to Presentation Catalog and reuse the same for other analysis.You can also change the properties of the new column in the Criteria tab but be aware that conditional formatting and conditional action links for the column are not saved to the catalog. Regular action links are saved for the column as well as the format properties.The saved column can be edited from the catalog pane and catalog page. All the changes that you make in the catalog are applied to every analysis that used this column. If you modify it inside a particular analysis, these changes are valid only for the analysis that you are working on.To be able to save new measures as columns you should have the Save Column privilege.


3. In this version we find a new new type of variables: the Global Variables. Global Variables can be defined in the context of an analysis and can be used in other analysis. Useful to do some intermediate reusable calculations.
4. Radio button and check box dashboards prompts can be showed horizontally. When you create a new dashboard prompt using check box or radio button under Options, you can select between horizontal or Vertical Layout appears under Options.


Export & Print options:

1.     In this version, you will find more options in the Print and Export Options dialog. You can select if you want to include charts, images and formatting or to specify column properties like the column width and to wrap the text in columns.

2.     Export menu no longer includes the Excel 2003 and PowerPoint 2003 options
3.     It is possible to set a limit to the number of rows downloading as CSV format

New RPD checkout option:

1.     If you need to check out an entire repository rather than using projects for multiuser development, you can use the Whole Rpd Checkout option


New Option in Administration Tool:

1.     Display Translation Key in presentation tree and Edit Presentation names options are now available in Administration Tool option for this release. Translation keys have been added to all presentation objects. The translation key is automatically populated and by default it matches the presentation object's name; however, you can modify the translation key. When you externalize display names in the Presentation layer and run the Externalize String utility, the results contain the translation key. You can right-click any Presentation layer object, such as a subject area, presentation table, or presentation column, and choose Externalize Display Names > Generate Custom Names or Externalize Descriptions > Generate Custom Descriptions to externalize strings.

Report/Dashboard Changes:

1.     Once you are in editing dashboard, you might see the Advanced Page properties option that set the scope of parameters in cases of Go URL, Prompted URL and Navigate to BI content:

 2. In Tables, Pivot and similar you can see Column properties from the edit window as well.


Courtesy :  Google :)


Tuesday, October 06, 2015

Steps to Replace Null Values in an OBIEE Pivot Table with 'No Data' or 'N/A' or 'No Description' using Custom Data Format

Scenario: 
Sometimes it is necessary to display numeric values in specified format or replace the null values in table or pivot table with zeros or custom text. OBIEE Answers and Dashboards give us a possibility to customize the data masks for presentation. This could be useful when we want to change the display of data for the purpose of a given report. Using Custom Data Format feature we can change the masks for numeric values, change the display of null values or show dates in custom format. 

Solution:

1) Using custom data format we can specify the custom formatting of columns used in an analysis. This formatting will be applied in report’s tables and pivot tables. To edit a data format for a given column, right click on it and choose Column Properties.

2) Click on Data Format tab and check Override Default Data Format. Select Treat Number As Custom from the list.


3) Now wrt your requirement , type the below examples in "Custom Numeric Format" tab:

a) We can display the values in thousands with K (kilo) letter
     #,#.0,K
 b) Values in millions with M
    #,#.0,,M
c) Values in billions with B
     #,#.0,,,B
d) Add a currency symbol
    £# or $#

How it works is:

‘#’ is a number sign indicating significant digits.
‘#,#’ adds a comma separator for thousands.
‘.0’  indicates the number of decimal places (‘0’ for round number, ‘.0’ for one decimal place, ‘.00’ for two, etc.).
‘,’ is a thousands separator (‘,’ for thousands; ‘,,’ for millions, ‘,,,’ for billions etc.).
‘K’,’M’,’B’, ‘$’,‘£’ are characters that can be added after or before the number mask.

The syntax for custom data formatting for numeric values is:

positive value mask ; negative value mask ; null mask
If we specify the mask without semicolon, the changes will apply to both positive and negative values.

Dealing with null values in numeric fields

Using Custom Data Format we can also specify what should be shown instead of null values, ie we can replace Null values with  '0', 'No data' or 'N/A' .


1) For showing zeros (0) instead of nulls, use the below syntax:

    #,##0;-#,##0;0

(which can be read as: number with one decimal place for a positive value, minus sign (-) and number with one decimal place for a negative value, zero (0) for a null value)
The null values will be replaced with zero.

 2) Replace Null with custom text like ‘Not available’ or ‘No data’ or  '-':

 #,##0;-#,##0;no data

#,##0;-#,##0; -

Our pivot table now shows something other than null values.

Dealing with null values in text fields

For text values the syntax for custom text format is non-null value mask, null value mask.
Set Custom Text Format to: @;No description
The null values will be replaced with ‘No description’ text.


 Cheers :)

Friday, June 12, 2015

Customize Login,Header,Images and Logos in OBIEE 11g

Customize Login,Header,Images and Logos in OBIEE 11g

 
To change background image for login page in Obiee 11g we need to follow below steps:

a) Delete existing image in below three locations and rename new image with background_blue_whitegradient_ and paste it in below three locations:

1) F:\OBIEE11g\Oracle_BI1\bifoundation\web\app\res\sk_blafp\login

2) F:\OBIEE11g\user_projects\domains\bifoundation_domain\servers\AdminServer\tmp\.appmergegen_1358364334516\analytics.ear\ukjjdc\res\sk_blafp\login

3) F:\OBIEE11g\user_projects\domains\bifoundation_domain\servers\AdminServer\tmp\_WL_user\analytics_11.1.1\silp1v\war\res\sk_blafp\login

b) delete browser cache and restart BIpresentation services in EM.


To change the Header Text next to the Oracle logo, navigate to the following path:
  • E:\OBIEE11g_Home\Oracle_BI1\bifoundation\web\msgdb\l_en\messages\productmessages.xml
 
Edit the following position in the file:
  • <WebMessage name="kmsgHeaderBIBrandName"><TEXT>abc</TEXT></WebMessage>
  •  Restart the services.


Courtesy : Google

Wednesday, March 25, 2015

Usage of Key Performance Indicators In OBIEE

To assess your business performance, you must define success via Key Performance Indicators (KPIs), benchmark metrics against which current performance can be measured.
OBIEE 11g allows you to define and customize KPIs, and to then integrate them into your dashboard. In this way you can assess current performance at a glance. Your KPI Watchlist can also be used to create analyses and agents that trigger based on certain threshold conditions and actions.


To create the KPIs, take the following steps:
1.    Log in to Oracle Business Intelligence Enterprise Edition 11g, using your username and password. From the home page, select New -> KPI from the common header area. When prompted to select a subject area, for example select any Sales/Revenue related.
  
2. The KPI Entry screen will then appear. This screen enables you to define the actual value and target value measures for the KPI, as well as an optional time offset to show performance as a trend.

3. Then, you specify the dimensionality of the KPI,by for example making it analyzable by two levels in the store hierarchy, and two in the time hierarchy or
you want users to be able to switch the product category for which the KPI is displayed but you want the year, 2010, to stay constant (or "pinned"). To do this, click the Add button on the Dimensionality screen, select the "Times"."Year" attribute, and select 2010 for Value. Then click Add again to add the "Stores"."Product" attribute column, but leave Value as Not Pinned. Click Next to proceed to the next step in the process: defining the thresholds. 
The values used for these dimensions can either be “pinned”,so that they stay static for this KPI, or
they can be dynamic, allowing the user to change them to vary their “point of view”. As well as using
regular  “attribute” columns to define these dimensions, you can also use complete hierarchies in the
form  of hierarchical columns from the semantic model presentation layer.


4. On the Thresholds screen, you can specify values that will determine whether the performance achieved warrants an OK, Warning, or Critical indication. In this example, performance will be considered OK if it is within 90 percent of the target and critical if it falls below 70 percent.


5.  Click Next to proceed to the next step, where you can define related documents for the KPI. This enables users to reference other analyses, external Web pages to support the KPI. For this example, however, there are no related documents, so click Finish to move to the final steps, where you can name and save the KPI.
 You can create more KPI in similar manner.


Displaying KPIs, Using a KPI Watchlist

Now that you have defined one or more KPIs, you can give users a means of displaying these on a dashboard through a KPI watchlist. To create a KPI watchlist, take the following steps:
1.    From the Oracle Business Intelligence home page, select New -> KPI Watchlist.
2.    From the Catalog view on the left-hand side of the screen, drag and drop the  KPIs you created previously onto the watchlist on the right. The selected KPIs will then be displayed in a grid format, showing the actual and target values, along with the variance and the percentage variance.


Courtesy : google :)


Sunday, April 13, 2014

OBIEE11g Grand Totals with Calculated formulae (divison)

Lately, we ran into a User specific scenario, where they wanted us to display Grand total row also as division of total members and participants, based on region.
We tried a lot to achieve it through aggregation rule, using server complex aggregate, but it was not giving correct result. As you can see in image below:


Scenario was to achieve Grand total for “% Finalized column” as 154.33  instead of summation (sum) 598.86. Since our report was a Union Report , so we tried new functionality of OBIEE 11g , named “Add Result Column”.
We wrote small formula in Edit column as below, where saw_1 is region, saw_2 is Total Members and saw_3 is Participants
(Sum(saw_2 by saw_1)/Sum(saw_3 by saw_1)*100.00)
This gave us the correct answer.

Stay Tuned J

Friday, October 25, 2013

OBIEE Architecture Design based on type of Installation


OBIEE Architecture Design  based on type of Installation:

The Oracle Business Intelligence 11g logical architecture comprises a single integrated set of manageable components which can be installed and configured to work together on a single host or can be clustered across multiple hosts for performance and availability

3 Types of Installation are available:

Simple Install

Purpose: Demonstration and Evaluation Single-User Development
Definition: Installation with the default settings on a single computer in the minimum number of steps.
Managed Server is not installed. Mainly used for demonstration, or PoC

Enterprise Install

Purpose: Enterprise Deployment for Hosted Development and Production
Definition : Enterprise Install type enables you to specify several more configuration settings than the simple

Software Only Install

Purpose: Enterprise Deployment for Highest Levels of Availability and Security
Definition: Installation of the binary files in Middleware home and useful if you want to have multiple domains or products share a common Middleware Home


Oracle Business Intelligence Components :

Java Components (WebLogic Domain)
Deployed as JEE applications
To service SOAP, HTTP, and other forms of requests
System Components (BI Instance)
Deployed as server processes
Provide the core services that enable OBI
Other Domain Contents
Includes all the necessary software, metadata, configuration files, RPD files, Oracle BI Presentation Catalog, and connection and database configuration information that are
required to run an Oracle Business Intelligence system.

They are managed mainly by 2 administrative user interface :
WebLogic Server Administration Console — which provides advanced management for Weblogic, Java components (BI Publisher, MapViewer, …), and security. 
 Fusion Middleware Control (Enterprise Manager) — which is used to manage the system components (C++, JSE) (BI Server, BI Presentation Services, Scheduler, ….)

Oracle Business Intelligence Components:

Administration Server
Components for administering the system are :

Web Logic Server Administration Console
Monitoring the health and performance of JEE servers
Configuring WebLogic server domains
Stopping and starting JEE servers
Viewing JEE server logs
Managing users in the LDAP Server of the WebLogic Server
Fusion Middleware Control
Starting, stopping, and restarting all system components
Scaling out of system components
Managing performance and monitoring system metrics
Performing diagnostics and logging
JMX Mbeans
Provides programmatic access for managing a BI domain


Managed Server and Node Manager
Managed Server
Provides run-time environment for the Java-based services and applications within the system
Node Manager
Process management services for the Administration Server and Managed Server processes

Managed Server Components
Oracle BI Presentation Services Plug-in
Routes HTTP and SOAP requests to Oracle BI Presentation Services
Oracle BI Action Services
Web services required by the Action Framework
Oracle BI Security Services
Integration of the Oracle BI Server with the Oracle Fusion Middleware security platform
Oracle BI Publisher
Enterprise reporting solution for authoring, managing, and delivering all types of highly formatted documents
Oracle Real-Time Decisions (Oracle RTD)
Analytics software solutions allowing companies to make better decisions in real time
Oracle BI SOA Services
Invoke OBI functionality from Business Process Execution Language (BPEL) processes
System Components
System components are deployed as non-JEE components (C++ and J2SE)
Oracle BI Server
– Query and data access capabilities at the centre of OBI
– Provides services for accessing and managing the enterprise semantic model. Also RPD resides here
Oracle BI Presentation Services
– Framework and interface for the presentation of BI data to Web clients
Oracle BI Scheduler
– Scheduling for analyses to be delivered to users at specified times
Oracle BI JavaHost
– Supports various components such as Java tasks for Oracle BI Scheduler,Oracle BI Publisher, and graph generation
– Also enables Oracle BI Server query access to Hyperion Financial Management and
Oracle OLAP data sources
Oracle BI Cluster Controller
– Distributes requests to the BI Server
Ensuring requests are evenly load-balanced across all BI Server process in the BI Domain


Oracle Process Manager and Notification Server (OPMN)
OPMN
Manage system components for Oracle Business Intelligence (for advanced users)
Supports both local and distributed process management
OPMN and Fusion Middleware Control
Fusion Middleware Control is the recommended approach for starting, stopping,
and viewing the status of components
OPMN is suitable only for advanced users

Basic Directory Structure of OBIEE :


WebLogic Server home
Contains Java components
User Projects
contains product domains (including one or more Oracle Business Intelligence domains),
Administration Server, and one or more Managed Servers
Oracle BI Home
Contains all the binary files (read-only) that are specific to Oracle Business Intelligence


 Some Useful Directories of the BI Instance:

Repository
%Middleware Home%\instances\instance1\bifoundation\OracleBIServerComponent\
coreapplication_obis1\repository
Web Catalog
%Middleware Home%\instances\instance1\bifoundation\OracleBIPresentationServerComponent\
coreapplication_obis1\catalog
NQSConfig.ini
%Middleware Home%\instances\instance1\config\OracleBIServerComponent\
coreapplication_obis1\repository
instanceconfig.ini
%Middleware Home%\instances\instance1\config\OracleBIPresentationServerComponent\
coreapplication_obis1\catalog
BI Server Logs (nqserver.log, nqquery.log)
%Middleware Home%\instances\instance1\diagnostics\logs\OracleBIPresentationServerComponent\
coreapplication_obis1

See you next tym :)    (Courtesy : Google)