Wednesday, November 23, 2016

How to use Server Variable in IBOTs/Delivers/Agents to show Dynamic text in OBIEE 11g/12c

IBOTS are Intelligent Bursting and Output tool, used in OBIEE, They are triggered by a schedule or a condition to deliver reports to recipients.

Sometimes the business requirments are to deliver the Reports as an attachment, with Dynamic text and Subject/Header.

So here i am to discuss the solution to use Server Variables for fulfilling the request. Lets start with using a server variables in Ibot Subject/Header.


ABC @{NQ_SESSION.VariableName} and EFG  @{NQ_SESSION. VariableName1}

Now to use a server variable in IBOT attachment note, is little different. Many places , many syntax are mentioned . But for me only this worked :

ABC @{biServer.variables['NQ_SESSION. VariableName']} and EFG  @{biServer.variables['NQ_SESSION. VariableName1']}


So use it an provide more efficient solutions to your client !

Cheers :)


Wednesday, November 02, 2016

OBIEE : Go Nav/ Go URL structure

The Go URL or Go nav is functionality of OBIEE, where summary reports  navigate to detail reports passing filters/options.

For example:

1) Basic structure:

http://<hostname>/analytics/saw.dll?Go&path= <full report path url>

2) To pass username and Password

http://<hostname>/analytics/saw.dll?Go&path= <full report path url>&NQUser=<username>&NQPassword=<password>

 3) To include Report links

Actual way to include the report links in drill/detail reports is to mention "&Options=x" in  GO URL path. The x can be one or more of the following letters:
  • m = Modify Request
  • f = Printer Friendly
  • d = Download to Excel
  • r = Refresh Results

 Like:  http://<hostname>/analytics/saw.dll?Go&path= <full report path url>&Options=md

or

http://<hostname>/analytics/saw.dll?Go&path= <full report path url>&Options=mfdr


4)  Printer Friendly. Results are in a printer-friendly format, without the paging controls, hot links, and so on.This is the format, "&Action=print" to be added in GO URL path

Like: ttp://<hostname>/analytics/saw.dll?Go&path= <full report path url>&Action=Print

5) Specific View. If your Detail report has more than 1 view of results (like Pivot/Chart/Bar graph etc) . This option shows an individual result view rather than the default compound view.
This is the format, where A is the name of the view:

http://<hostname>/analytics/saw.dll?Go&path= <full report path url>&ViewName=A


 6) To pass report filters:

Sometimes we get requirement in OBIEE summary report to drill to detail report passing few column filters, like: here we are passing 2 column values as filter in detail report. P0 defines the number of parameter passed including the type (equal/ >=  etc.)

http://<hostname>/analytics/saw.dll?Go&path= <full report path url>&Action=Navigate&P0=5&P1=eq&P2=<Parameter_Name1>&P3=<Parameter_value1>&P4=<Parameter_Name2>&P5=<Parameter_value2>


Note: Remove < > symbols. I have used them to highlight.

Wednesday, September 07, 2016

Different Tool tip for different column values in OBIEE11g/12c

In OBIEE 11g or 12c, we can add ToolTip to the report on columns. Last week i had a requirement to display different tooltips/text on every column value to users when user hovers on different row in that column of a report.
This is not an OBIEE feature. To get a solution to it, we can try using Javascript in Narrative view. But i tried a different solution.

Req: We have to display different text over different column values. For example below, we have to show Response values in ToolTip, when users hovers over the Product column. Responses can differ.


Step 1: So we created a Dummy KPI in RPD, called Responses and stored the different values (Good/Fair etc ) in it.
Step2: Now in Obiee Report, over the Product column made few changes:
     a) In the 'Column Properties' , under 'Data Format' tab, I am choosing HTML
     b) In column edit formula wrote below:

<HTML> <span title= ' || "Dim"."Responses"|| '>' || "Dim"."Product" ||' </span> <HTML>

Note:
i) You can skip using HTML.      
ii) You can write a Case formula in place of Product column, ie column on which you want the hover text.
iii) For Numeric column value, use Cast function to convert it to Char().


Courtesy: Google

Monday, August 01, 2016

Steps to configure Write Back Functionality in OBIEE 11g

Write Back is the feature/ability in OBIEE to allow the user to enter a value or values directly into a report and have those values written to an actual physical table in the database.You can use this functionality only in a table view. If you want to use it on a pivot, you must first transform your table view as a pivot view

RPD changes to set Write Back :

Step 1:Physical Layer - Select a table to which you would like to Writeback. Double click it to open the Physical Table Properties.In General tab, uncheck Cache-able

Step 2: Business Model & Mapping Layer -Go to the table column (same as the physical layer.Double click column to open the logical column properties. In General tab, check Writable option.

Step 3: Presentation Layer -Double click the column and click on Permissions. Now in the General Tab -> Permissions -> Set permission -> Read / Write (Radio Button), on the User / Application Role which you want to authenticate for Writeback feature.

Step 4: User/Application Role - In RPD, Go to -> Manage-> Identity Manager -> Identity Management (Left pane) -> Select Application Role (to which you need Write Back Permission) -> Permission -> Query Limits (tab) -> Select Database (to which you need direct database execution rights) -> Change option from ignore to allow to the field named "Execute Direct Database Requests".


Write Back Template :

Step 1: Check the "LightWriteback" tag within  the server instance tag of instanceconfig.xml file. If it not true, set it to TRUE. If this entry already exists then no modifications required. If modified then restart OracleBI Presentation Services for this change to be effective.

<LightWriteback>TRUE</LightWriteback>


Step 2: Writeback Template. You may give any name for the Writeback.xml file. Here for example,we are using the file name as Writeback_sample.xml

Things to do before you start the Template:
  • We can use the column position or by column id in the XML definition. 
  • We must include both insert and update statements in the template.
Template to be placed in the path: $ORACLE_INSTANCE/bifoundation/OracleBIPresentationServicesComponent/coreapplication_obips1/analyticsRes/customMessages


[ Note -Above insert & update code is only for sample purpose & content within <!-- #### --> are comments. If we do not want to include SQL commands within the elements, then we must insert a blank space between the opening and closing tags. eg. <insert> </insert> rather than <insert></insert>]

In the above xml code, we have few important tags -


  • WebMessage name - The name here will be used as Writeback template name in analysis -> Table Properties -> Write Back.
  • Write Back ConnectionPool - Connection pool name for Write Back.
  • insert - Based on your requirement or leave blank ( if not required)
  • update - Based on your requirement or leave blank ( if not required)
Now lets proceed to know what changes we need to make in analysis for the write back report.

C- Changes in Analytics :

Step 1Give Privilege to the Role for Write Back ( Analytics Home Page ->Administration -> Manage Privilege -> Write Back & add the role for Writeback privilege). 
Step 2Now you need to go to that column, right click, open Column Properties -> Writeback tab-> Check 'Enable Write Back' of the field needed for write back, from criteria tab.
Step 3: Now edit & go to Table Properties view -> writeback tab & tick the 'Enable Write Back' & mention Template Name as mentioned in Writeback file ( WebMessage name="WriteBack_Template_Example). You may also rename Apply/Revert/Done Buttons & set positions.

Now please test the report for writeback features.


Courtesy : Google :) 
 

Wednesday, July 13, 2016

Creating Word / Tag Clouds in Obiee 11g

Like we discussed in my other blog over D3 visualizations in Obiee 11g, we have another data visualization technique called “word clouds”, that is used to graphically show word distributions in unstructured data sets through font sizes and orientations. For example, the word cloud shown below display the company names in different sizes/fonts.


It can be implemented in OBIEE11g reports, without using any extra help. We just have to create a dummy column using any logic to get dummy values ranging between 5 to 70 and then in Narrative View we can use this column in font size of Company column.

for example: I created a dummy column C1 like (count Of Transaction) * 5) / Max (count Of Transaction). This will give me value range from 5 to 70 ( you can range your values depending on Font size required in Cloud).

Now in Narrative View, while displaying the Company name column, mention Style (font-size = @C1;) and its done.

Do try it.


Data Visualization (D3) in OBIEE 11g

One of the great features of Oracle's Business Intelligence 11g foundation is the ability to integrate external applications through the use of java script libraries.Today we're going to expand on this functionality by integrating third party(open source) data visualization java script library used for data manipulation ie D3. To describe, its Data Driven Documents.

Oracle have added powerful new data visualization capabilities that turn raw data into insightful information.D3 helps you bring data to life using HTML, SVG, and CSS. D3’s emphasis on web standards gives you the full capabilities of modern browsers without tying yourself to a proprietary framework, combining powerful visualization components and a data-driven approach to DOM manipulation.  For example, you can use D3 to generate an HTML table from an array of numbers. Or, use the same data to create an interactive SVG bar chart with smooth transitions and interaction.

You can download or get the D3 files (HTML) online.These files contain the basic code of creating visual designs like Bar Column, Candlestick, Pie, Doughnut, Funnel etc. After downloading this file, either we can directly make an external call to it or we can place it in OBIEE server at following location (You can check with your admin to see if file needs to be placed on some other location also) :

user_projects\domains\bifoundation_domain\servers\bi_server1\tmp\_WL_user\analytics_11.1.1\7dezjl\war\res\

In order to embed a D3 visualization in OBIEE you’ll need to first create  sample report and then use a Narrative view to display products Transaction count via Region (example). This will enable you to gain access to the data that we need to drive our visualization using the @n substitution variables where n equals the column position in the criteria or in the array.

So let's create a simple report of Region, Product & its selling count. Now in Narrative View, we will try to create a doughnut design displaying Region wise Count spread.
In the Prefix section at the top we will declare a JavaScript array variable called “n” that will contain the data from the analysis like this:

var n=[];

This array will hold Data elements like below:


The Narrative section should contain the following code :

n.push({Count:@2, LegendText:"@1",indexLabel:@2});

where @1, @2 substitute for  Region & Transaction Count respectively and will dynamically generate the JavaScript to populate our array. LegendText tag is used to show the Regions in Legend, and IndexLabel is to show data value in Index.

 Now in Postfix section,we have to write load of JavaScript code, in which we call the array in a function, mention the font style/color/size, decide the legend style etc. It should look similar to below. You can modify it further as required.


Now if you see the final output:


Friday, April 01, 2016

How to Insert a Checkbox in Excel

Now a days excel is very useful to maintain information/data. Excel provides so many options to do our task in an interactive ans easy manner. Like inserting a checkbox in Excel. The checkbox control is available in the Excel developer tools option. Check box and other controls like drop down menu can be quite helpful while designing forms in Excel.

 How to start :

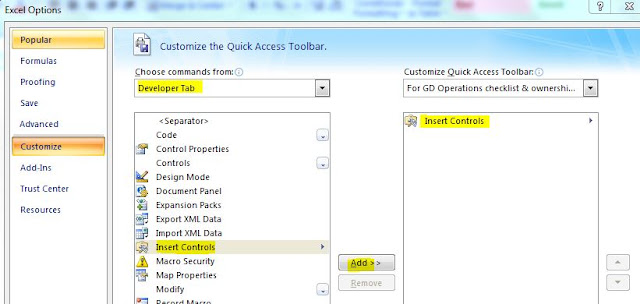
1) Open an excel sheet.Will show you how it works on 2007. Navigate to File > Excel Options > Customize > Now select Developer tab from drop down 


2)  In Developer tab , select the "Insert Control " option, add it to the “All Tabs” pane on right side and click the “OK” button.


3) Now you see “Insert Controls” tab/Button on your excel top ribbon. Click and you see lot many Controls like Form Control (Button, combo box,List etc) , ActiveX control(Img, Label, Radio button etc) .Select the “Checkbox” control from Form Controls as below


4) Now, you can drag and draw a checkbox anywhere on your excel sheet. Similarly with other controls. You can also play along with its properties.


:)